Monitoring
A deployed model can be monitored by the user for data outliers, performance issues and to see the current usage of the model. Each deployment has its own monitoring view.
To open the monitoring view go the Deployments view and click on the Monitoring button of the deployment.
You can filter for two variables:
Time Range - Filter Requests from the last 7, 30, or 90 days.
Clients - Filter the requests per client or for all clients.
The monitoring view is divided up into three sections:
Total Requests- See the amount of requests made and their OOD state.Requests- A graphical representation of the requests made to the model.Request Time- The latency of the requests.
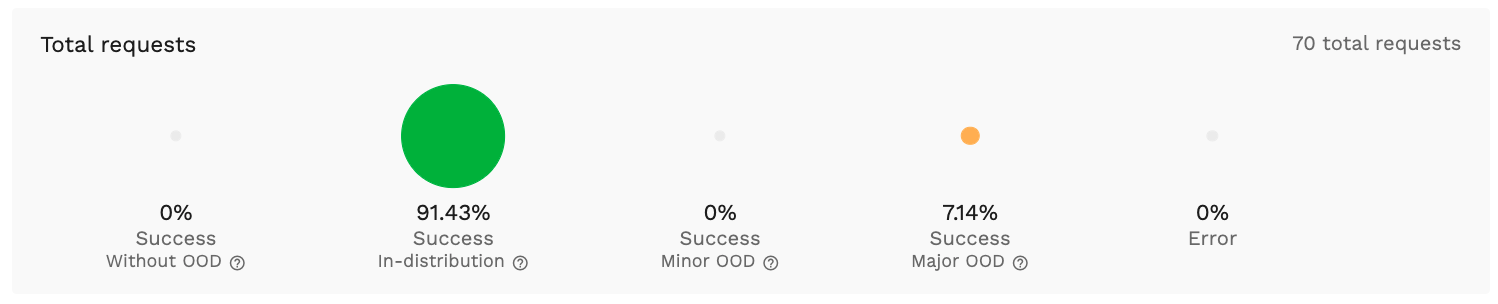
Total Requests
Each request can be one of five states that are represented as bubbles in this section.
Request States
Success Without OOD- The request was successful and not out-of-distribution detection was done.Success In-distribution- The request was successful, and the data sent to the model was in-distribution.Success minor OOD- The request was successful, and the data sent to the model was in-distribution but can be seen as outliers since it rarely appeared in the training data.Success major OOD- The request was successful, and the data sent to the model was out-of-distribution meaning that the data did not appear in the training data, and the data is not known to the model. This will result in nonsensical predictions.Error- The request to or response of the model failed. This is likely due to an ill formatted request, or an error in the model itself.
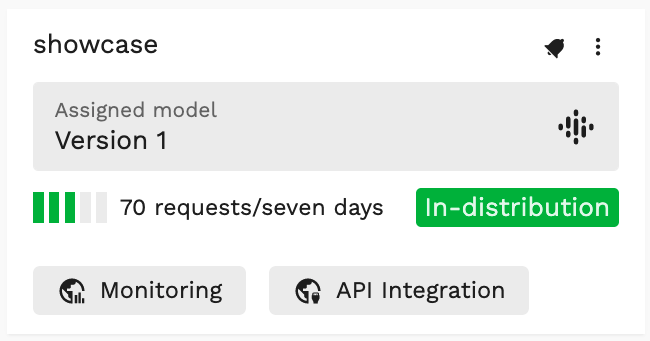
The state shown in the info screen shows the current state of the model. This state changes depending on the majority of the requests that happened in the last 7 days. Once the majority state changes the state will change and a user that is watching the deployment will be notified.
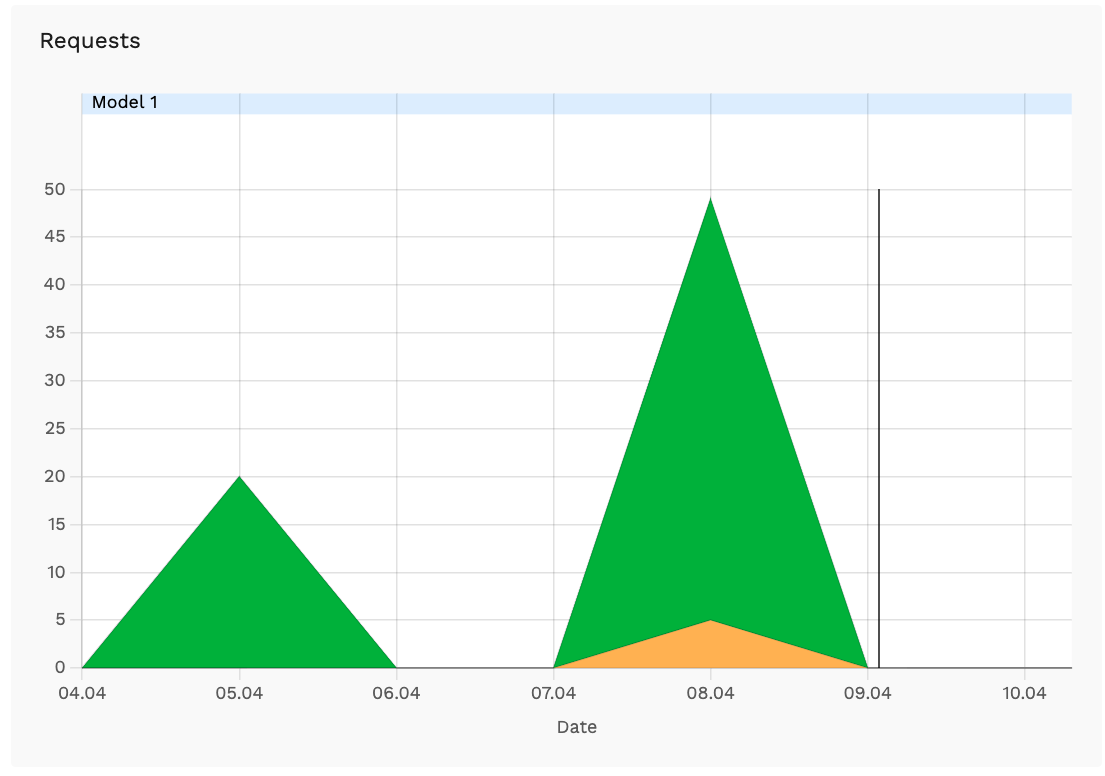
Requests
On the Requests screen you can see at a glance how many requests have been made. You can also see when a model was reassigned to a deployment so the user can determine wether the redeployment affected the state of the requests.
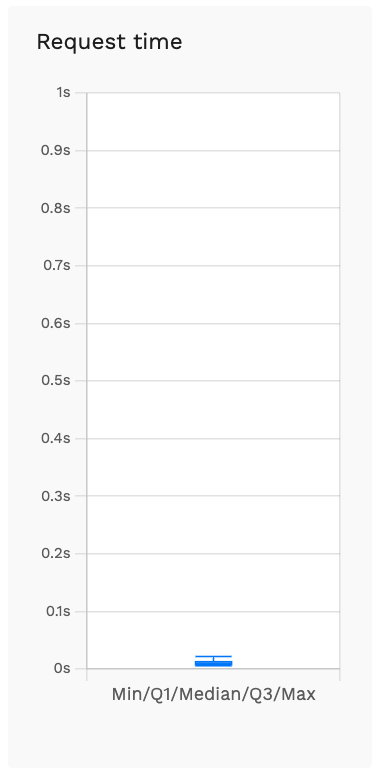
Request Time
The Request Time screen shows you the average latency as well as the latency range of the requests.